 Search
Authors:
Todd Matthews, MBA, Senior Director, Corporate Alliances, IQVIA
Dean Giovanniello, RPH, MBA, Sr. Principal, Financial Institutions & Brand and Commercial Strategy Consulting Services, IQVIA
Quantifying the Potential
In our previous posts, we explored how early-stage biotech companies can craft a compelling value story through a strategic Target Product Profile (TPP) and choose the right development path using a robust Clinical Development Plan (CDP). Now, we turn to the third pillar of investor engagement: demonstrating the value of your approach through data-driven insights, specifically, the use of expected net present value (eNPV).
Why eNPV Matters to Investors
In today’s capital-intensive biotech landscape, investors are looking for more than scientific promise, they want quantifiable proof that a drug candidate is a sound investment. The eNPV framework transforms scientific uncertainty into financial clarity by integrating assumptions around development time, cost, risk and return across multiple scenarios.
This metric allows companies to objectively assess the potential value of their asset at the end of its projected development path. It also enables comparisons between different molecules, indications and development strategies, helping investors understand the trade-offs and potential upside.
“The eNPV provides stakeholders with a robust and neutral viewpoint, and can be used to compare different pathways, molecules or indications, while also demonstrating the impact of trade-offs.”
Building a Credible eNPV Model
To build a robust eNPV model, companies must use high-quality inputs and domain-specific knowledge. This includes:
- Accurate cost estimates adjusted for trial size, complexity and geographic scope
- Realistic timelines based on regulatory pathways and anticipated recruitment rates
- Probability of success informed by historical data across therapeutic areas and drug types
For example, the composite success rate from Phase I to approval increased slightly to 7% in 2024, driven by a rebound in Phase III success rates to 59%. However, the transition from Phase II to Phase III remains a significant hurdle, with efficacy being the key challenge.
Enhanced Therapeutic Area Insights
Domain knowledge is critical when selecting indications and calculating eNPVs. Historical approval probabilities vary significantly:
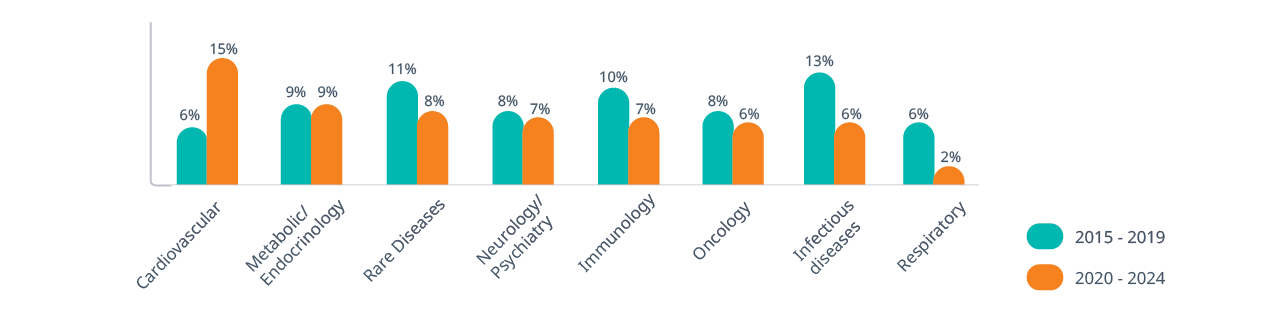
- Cardiovascular: Success rates rose from 6% (2015–2019) to 15% (2020–2024), making it a more attractive area for development
- Infectious diseases: Dropped from 13% to 6%, signaling increased risk
- Rare diseases: Maintain a composite success rate of nearly 10%, benefiting from expedited regulatory pathways and high pricing potential
- Oncology and neurology/psychiatry: Despite high development activity, these areas face lower success rates due to complex biology, endpoint challenges and patient heterogeneity
Composite success rate by therapeutic area
Enhanced Drug Type Considerations
The type of drug also influences risk and value:
- Biologics: Continue to outperform small molecules in terms of clinical success, particularly in Phase III, due to targeted mechanisms and favorable safety profiles
- Reformulated small molecules: Benefit from existing safety and efficacy data, reducing risk at each stage
- Gene and cell therapies: Show strong early-phase promise but require careful planning around regulatory and manufacturing complexity
- Biomarker-driven programs: Especially in oncology and rare diseases, demonstrate significantly higher success rates, underscoring the value of precision medicine approaches
Understanding these nuances allows companies to refine their eNPV models and present a more compelling case to investors.
Scenario Modeling: Comparing Strategic Approaches
One of the strengths of the eNPV framework is its ability to support scenario modeling. Companies can simulate different development approaches, compare their impact on value creation, and understand the key assumptions driving that value. This enables management to focus on validating the assumptions that have the greatest positive or negative impact.
- Aggressive: Shortest time to launch, highest risk, lowest eNPV. Appeals to investors seeking fast ROI
- Conservative: Longer timeline, higher cost, highest eNPV. Ideal for long-term investors
- Standard: Balanced approach with moderate risk and return
This modeling helps companies align their strategy with investor preferences and risk tolerance.
Communicating Value with Confidence
A well-constructed eNPV model is more than a financial tool, it’s a strategic communication asset. It allows biotech leaders to:
- Quantify the impact of development decisions
- Demonstrate alignment with market and regulatory realities
- Provide investors with a neutral, data-driven view of asset potential
By integrating eNPV into investor presentations, companies can move beyond abstract promises and offer concrete projections grounded in evidence.
Final Thoughts
Demonstrating the value of your biotech asset through data-driven insights is essential to securing venture capital. The eNPV framework provides a powerful way to translate scientific and strategic decisions into financial terms that resonate with investors.
Together with a strong TPP and CDP, a credible eNPV model completes the trifecta of tools that early-stage biotech companies need to turn vision into venture capital.
Visit us at https://www.iqviabiotech.com/visionaries to learn more.
References
Clinical Development Success Rates and Contributing Factors 2011–2020. Biotechnology Innovation Organization (BIO), Informa Pharma Intelligence, and QLS Advisors, Biomedtracker and Pharmapremia, 2021, https://go.bio.org/rs/490-EHZ-999/images/ClinicalDevelopmentSuccessRates2011_2020.pdf
Aitken M, Roland A, Kleinrock M. Global Trends in R&D 2025: Progress in Recapturing Momentum in Biopharma Innovation. March 2025. IQVIA Institute for Human Data Science. https://www.iqvia.com/insights/the-iqvia-institute/reports-and-publications/reports/global-trends-in-r-and-d-2025